TrueNAS Scale Pool Metrics
TrueNAS Core, the BSD based version of TrueNAS, includes metrics outputs that come with pool usage statistics, something you may expect from a storage operating system. TrueNAS Scale, the Linux base version includes many performance metrics that you can export, but surprisingly not pool usage.
For my home metrics, I use Prometheus, InfluxDB, and Grafana. To solve the lack of pool usage metrics, I started considering the project https://github.com/bdinpoon/upsmonitor which I use to take UPS metrics and report them to InfluxDB.
This led me to the following steps to collect TrueNAS pool metrics, through InfluxDB and Grafana. I hope it helps you too!
Steps
-
Have a working InfluxDB v2 and Grafana instance.
-
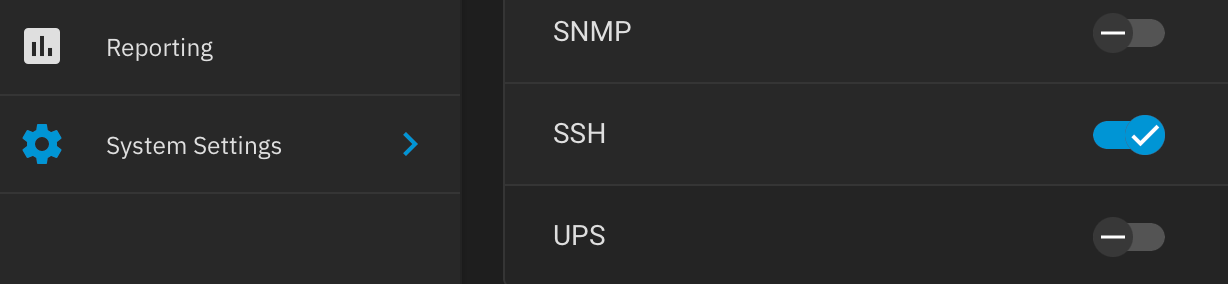
Enable SSH for your TrueNAS Scale installation from the
System Settings -> Servicesmenu, toggle on SSH.- You also need to enable SSH password authentication for whatever user you are using to SSH to your TrueNAS Scale system.
-
SSH to your TrueNAS Scale system
-
Copy the following code into a script in the home directory of your TrueNAS user.
- I'm using the
Adminuser for this - I call my script
diskmonitor.sh - Set the hostname for your host in the script, mine is
hl15 - You may notice that I am not using the
TARGETvariable in my script even though I do pull it from thedfcommand. InfluxdB was flagging that field as a "boolean" even though in my examples nothing ever appeared to be a boolean value. Since I'm getting the file system value through the FILESYSTEM variable, I just skipped tossing it into InfluxDB.#!/bin/zsh # My example: # DBHOST="influxdb.mktbs.io" DBHOST="DNS or IP for your InfluxDB" # My example: # ORGNAME="mktbs" ORGNAME="Your InfluxDB org name" # My example: # BUCKET="truenas" BUCKET="Your bucket name" # My example: # APITOKEN="BmVR-aBglYUxll6EMLCTg==" APITOKEN="Your InfluxDB API token" # Set the variable DISKUTIL to be the result of the df command, # specifying the size values in 1 Byte steps, and using sed to # remove the first (header) row of the result DISKUTIL=$(df -B1 --output=source,size,used,avail,target|sed '1d') # For each row in the returned DISKUTIL value, use awk to grab the value # of each column we pull back. We then use curl to post the # data to the InfluxDB API. We send the output to /dev/null # so we don't have excess console output. while read -r line; do FILESYSTEM=$(echo "$line" | cat | awk '{print $1}') TOTALSIZE=$(echo "$line" | cat | awk '{print $2}') TOTALUSED=$(echo "$line" | cat | awk '{print $3}') TOTALAVAIL=$(echo "$line" | cat | awk '{print $4}') TARGET=$(echo "$line" | cat | awk '{print $5}') /usr/bin/curl -s -i -X POST "https://$DBHOST/api/v2/write?org=$ORGNAME&bucket=$BUCKET&precision=ns" \ --header "Authorization: Token $APITOKEN" \ --header "Content-Type: text/plain; charset=utf-8" \ --header "Accept: application/json" \ --data-binary "disk_status,host="hl15",host_volume="$FILESYSTEM" disk_size=$TOTALSIZE,disk_used=$TOTALUSED,disk_available=$TOTALAVAIL" > /dev/null done <<< "$DISKUTIL"
- I'm using the
-
Updated the variables in the script to match your environment.
-
Make the script executable with
chmod +x.- In my case this is
chmod +x diskmonitor.sh
- In my case this is
-
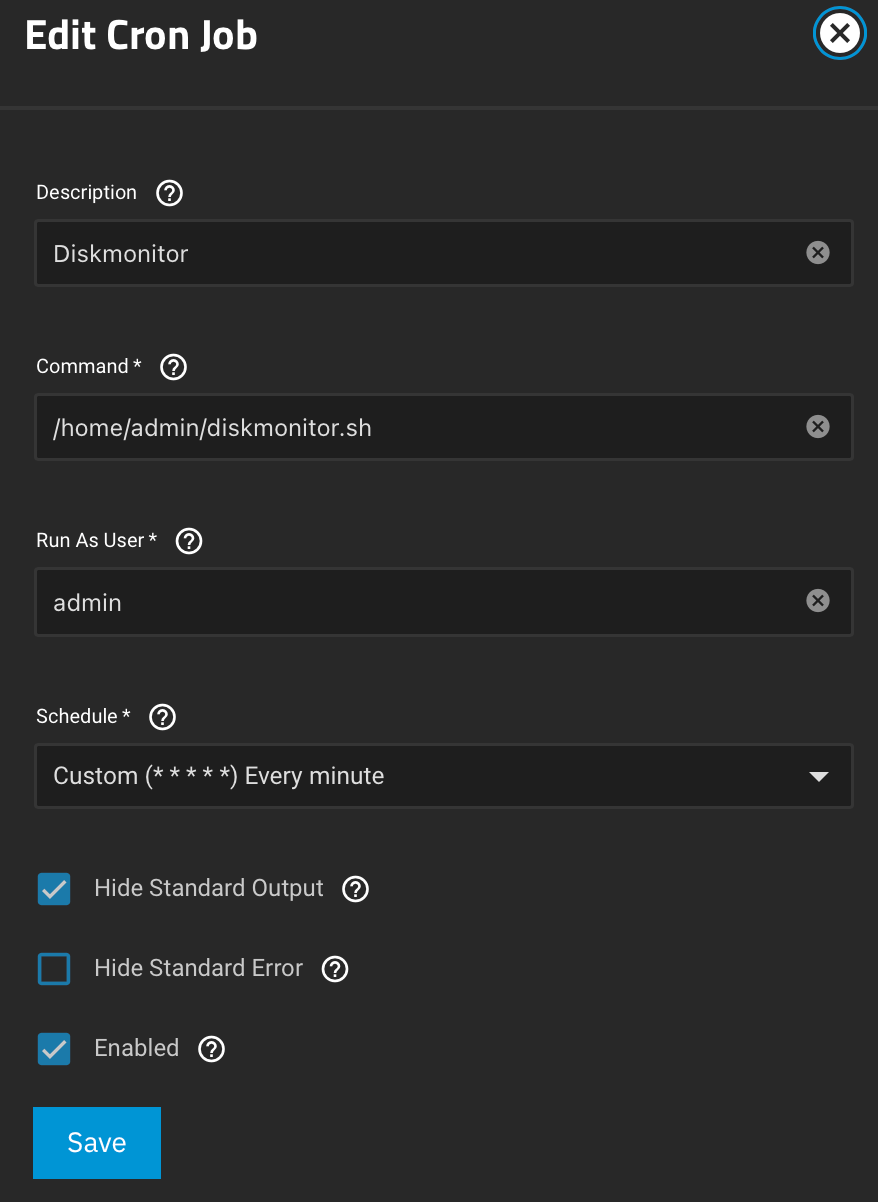
Visit the
Cron Jobssection of theSystem Settings -> Advanced -
Create a new cron job, specifying the location of the
diskmonitor.shscript.- Given how often I want to display metrics, running this script on a cron every minute fits my use case just fine. Of course you can set this to be any period of time that works for what you are looking to display in Grafana.
-
Add your InfluxDB data source in Grafana matching the org and bucket from what you configured in the script.
-
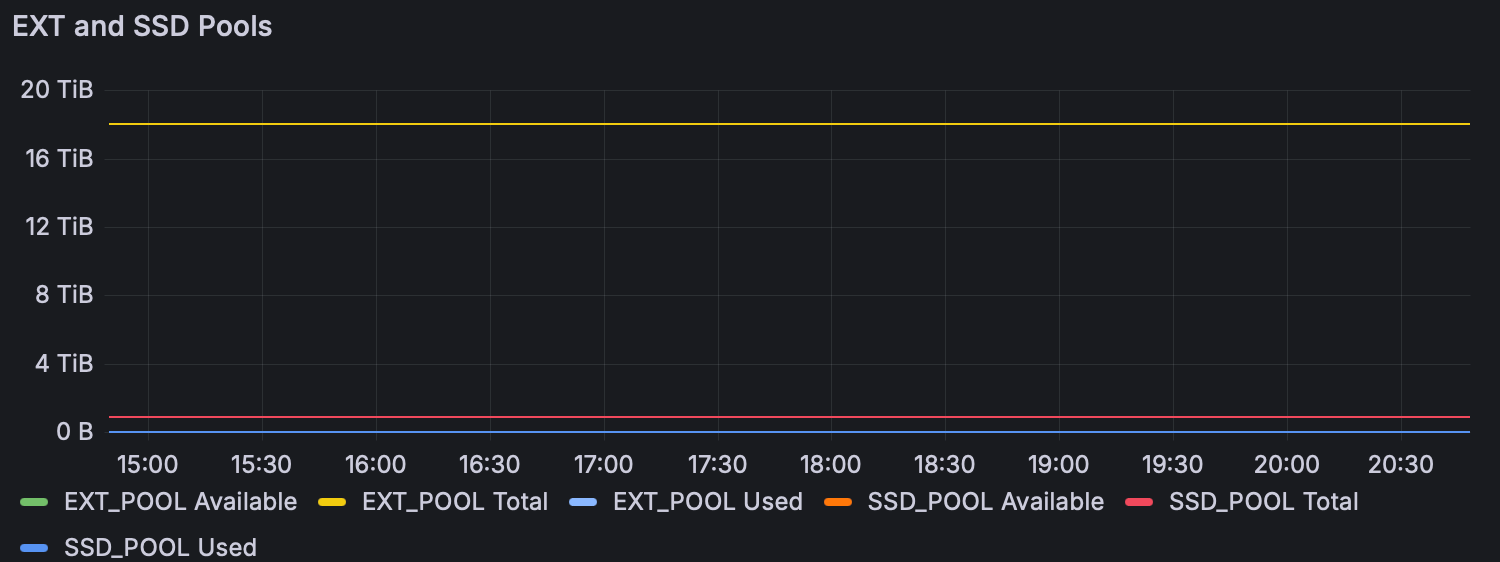
In Grafana, add a new panel. The following code is my InfluxDB Flux query for the total, used, and available disk size for my pools
SSD_POOLandEXT_POOL
from(bucket: "truenas")
    |> range(start: v.timeRangeStart, stop: v.timeRangeStop)
    |> filter(fn: (r) => r["_measurement"] == "disk_status")
    |> filter(fn: (r) => r["host"] == "hl15")
    |> filter(fn: (r) => r["host_volume"] == "SSD_POOL" or r["host_volume"] == "EXT_POOL")
    |> filter(fn: (r) => r["_field"] == "disk_available" or r["_field"] == "disk_size" or r["_field"] == "disk_used")
    |> aggregateWindow(every: v.windowPeriod, fn: mean, createEmpty: false)